

Thursday, September 27, 2012
Silver ~ Update ~ 27 September 2012
The rally in silver has been impressive so far: +25% since mid August.

If 33/34ish holds, the current pullback should only be a short-term correction and new highs should follow shortly.
If 33 breaks though, 35ish is most likely a medium-term top and a bigger correction might unfold.

If 33/34ish holds, the current pullback should only be a short-term correction and new highs should follow shortly.
If 33 breaks though, 35ish is most likely a medium-term top and a bigger correction might unfold.
Wednesday, September 26, 2012
Gold ~ Update ~ 26 September 2012
Gold hit my target of 1790-1800 on Friday last week:

We've already corrected about 50 handles since then, hitting the support at 1740ish today. 1720-40 is my preferred area for this short-term correction. After that the rally should continue.
Should we decline further, a medium-term top is probably in for now and a drop 1680 or even 1630ish seems likely.
SPX/ES ~ Intraday Update ~ 26 September 2012
The SPX declined much more than I expected. 1440ish was immediately broken and the market lost another 10 handles. Currently, we're down only about 4 handles and if we could close around 1440, we would have a very bullish candle.
Below is a chart of the ES and not the SPX because the very strong support area at 1420-30 is clearly recognizable on the ES chart:
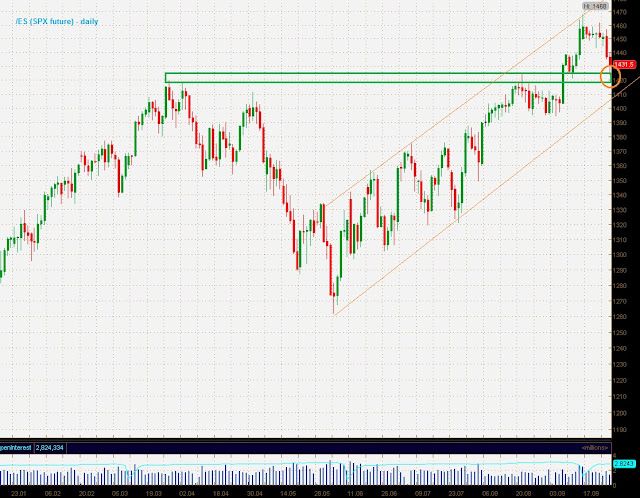
If we don't get a bounce at this area, I'd be very surprised.
Below is a chart of the ES and not the SPX because the very strong support area at 1420-30 is clearly recognizable on the ES chart:

If we don't get a bounce at this area, I'd be very surprised.
S&P 500 - Pre-Market Warm-Up - 26 September 2012

The SPX is approaching strong support at 1440ish. I think we could see a bounce here up to 145xish.
Tuesday, September 25, 2012
Dow Jones ~ EOD Update ~ 25 September 2012
The Dow rallied to the upper end of the big range and then turned down and even broke below the range late in the day.
Unfortunately, I wasn't able to post an intraday update but I hope you caught the nice shooting star we got this morning:

If we zoom out a bit, we can see that this is most likely only a short-term correction as the medium-term trend is still clearly up:

Unfortunately, I wasn't able to post an intraday update but I hope you caught the nice shooting star we got this morning:

If we zoom out a bit, we can see that this is most likely only a short-term correction as the medium-term trend is still clearly up:

Monday, September 24, 2012
Dow Jones ~ Intraday Update ~ 24 September 2012
The Dow declined to the lower trendline of the sideways range again today. The next target seems to be the top of the range at 13640ish again:


Dow Jones ~ Pre-Market Warm-Up ~ 24 September 2012
The Dow broke out of the bull flag on Friday but only managed to rally to the bull market high. By the end of the day we were back inside the flag:

The last few days have been quite difficult to analyze but it looks now like we're in another sideways range as we've seen it multiple times during this bull market. Often these ranges were broken after a gap up/down or during a very strong up/down day.

The last few days have been quite difficult to analyze but it looks now like we're in another sideways range as we've seen it multiple times during this bull market. Often these ranges were broken after a gap up/down or during a very strong up/down day.
Thursday, September 20, 2012


S&P 500 ~ Intraday Update ~ 20 September 2012
The short-term buy signal was cancelled after the SPX declined below 1461 again.

The SPX dropped to 1450 earlier today and is now back at the resistance at 1457ish.

The SPX dropped to 1450 earlier today and is now back at the resistance at 1457ish.
Wednesday, September 19, 2012
S&P 500 ~ Intraday Update ~ 19 September 2012
The 1461/62 level was breached earlier today and retested about an hour ago:

If we don't sell off in the last hour and can hold above 1461/62, I think we'll rally back to the highs tomorrow/Friday.

If we don't sell off in the last hour and can hold above 1461/62, I think we'll rally back to the highs tomorrow/Friday.
Tuesday, September 18, 2012
S&P 500 ~ Intraday Update ~ 18 September 2012
The correction is still underway:

The bullflag I showed yesterday was actually slightly broken this morning. Without much conviction though since the SPX couldn't even turn positive for the day.
As you can see if you compare yesterday's and today's chart, I shifted the flag a bit. It would probably be better though, if I drew a curve instead of a trendline, as the bullflag seems to flatten a bit each day. So I think it's better to have a look at the resistance around 1461/62 which could be a great long opportunity if broken.
Monday, September 17, 2012
S&P 500 ~ EOD Update ~ 17 September 2012
The pullback continued today:

If the bull flag is convincingly breached, new highs are likely.

If the bull flag is convincingly breached, new highs are likely.

S&P 500 ~ Elliott Wave Count ~ 17 September 2012
Below are the updated counts for the SPX:


As you can see, I matched the SPX count with the Dow Jones count. As mentioned last week, the overall direction doesn't change, only the subwaves are slightly different.


As you can see, I matched the SPX count with the Dow Jones count. As mentioned last week, the overall direction doesn't change, only the subwaves are slightly different.
Friday, September 14, 2012
USD/JPY ~ Update ~ 14 September 2012
The USD/JPY dropped below the support around 78ish:

As long as we don't get a convincing break of 78ish, we should eventually see 76ish.

As long as we don't get a convincing break of 78ish, we should eventually see 76ish.
Thursday, September 13, 2012
EUR/USD ~ Update ~ 13 September 2012
Target hit:

1.30 seems to be some solid resistance. Thus, I think we'll see a correction. If 1.30ish is convincingly breached though, a rally to 1.33 should be next.

1.30 seems to be some solid resistance. Thus, I think we'll see a correction. If 1.30ish is convincingly breached though, a rally to 1.33 should be next.
Dow Jones ~ Elliott Wave Count ~ 13 September 2012
After today's move, the count looks now even better : )

If this count is correct, we should see new all-time highs fairly soon. If we decline much below 13300 though, then this count is most likely wrong.

If this count is correct, we should see new all-time highs fairly soon. If we decline much below 13300 though, then this count is most likely wrong.
S&P 500 ~ Pre-Market Warm-Up ~ 13 September 2012
The SPX has been trading in a very tight range for the past week - around 1336 +/- a few handles:

It looks like the SPX is forming a triangle again. Usually, such triangles break to the direction of the larger trend (i. e. up). However, I'd like to get some confirmation first, which is a break above 1440ish. If we get it, we should see a move to at least 1450.

It looks like the SPX is forming a triangle again. Usually, such triangles break to the direction of the larger trend (i. e. up). However, I'd like to get some confirmation first, which is a break above 1440ish. If we get it, we should see a move to at least 1450.
Wednesday, September 12, 2012
USD/CHF ~ Update ~ 12 September 2012
The USD/CHF is at an important level:

If 93.00-50ish holds, we could get another move up to the upper trendline. If it breaks though, a decline to 0.90ish seems likely.

If 93.00-50ish holds, we could get another move up to the upper trendline. If it breaks though, a decline to 0.90ish seems likely.
Tuesday, September 11, 2012
Dow Jones ~ Elliott Wave Count ~ 11 September 2012
You've probably noticed that the action during June and July of this year is almost impossible to count as part of a motive wave and looks much more as some kind of a corrective wave. However, the SPX already breached the May highs which reduces the probability of a corrective wave.
Thus, I tried to count it as a leading diagonal (>> SPX >> Medium-term). It's also possible to count it as a series of 1-2's as other bloggers did. Yesterday though, I think I found a much better solution:

Wave (B)/(2) ended in late July and not in early June. Thus, June and July were indeed corrective and part of wave (B)/(2). Wave (C)/(3) started in late July. The subwaves 1 and 2 of (C)/(3) are most likely finished and subwave 3 should be underway now.
As we still haven't breached the May highs in the Dow, I'd wait for a break first. If we get a break, wave 3 to 14000+ should be underway and we shouldn't fall below 13150ish again.

Monday, September 10, 2012
USD/JPY ~ Update ~ 10 September 2012
The USD/JPY keeps bouncing off of the 78ish level:

As you can see in the chart above, the bounces get smaller though which results in a nice triangle. A break below the lower trendline (and the support area at 78) should lead to a decline to 76ish. A break above the upper trendline on the other hand, should lead to a rally to 80.5ish.

As you can see in the chart above, the bounces get smaller though which results in a nice triangle. A break below the lower trendline (and the support area at 78) should lead to a decline to 76ish. A break above the upper trendline on the other hand, should lead to a rally to 80.5ish.
S&P 500 ~ Intraday Update ~ 10 September 2012
After almost hitting the resistance at 1440 early morning, the SPX is now pulling back and hit the first support level a few minutes ago:


Gold ~ Update ~ 10 September 2012
Gold hit the resistance at 1720ish last week, corrected about 25 $, and then broke 1720ish on Friday:

The next target should be 1790-1800.

The next target should be 1790-1800.
Friday, September 7, 2012
Silver ~ Update ~ 7 September 2012
After a small pullback yesterday from 33 to 32, silver now broke the resistance area at 33$:

The next target should be 37. Support is now at 32.5-33 and 31.

The next target should be 37. Support is now at 32.5-33 and 31.

S&P 500 ~ Intraday Update ~ 9 September 2012
It looks like we're about to complete five waves up from the low (1396):

If so, we should see a correction into early/mid next week.

If so, we should see a correction into early/mid next week.
EUR/USD ~ Update ~ 7 September 2012
The EUR/USD hit the long-term declining trendline today:

If we get a daily close clearly above it, the long-term trend is up again.
If the resistance area at 1.2700-50ish is breached, the next target should be 1.30ish.

If we get a daily close clearly above it, the long-term trend is up again.
If the resistance area at 1.2700-50ish is breached, the next target should be 1.30ish.
Thursday, September 6, 2012
Gold ~ Update ~ 6 September 2012
Potential Elliott wave count for gold:

Wave V to new highs seems to be underway. As long as 1630/40 holds, this count (wave V underway) looks good.

Wave V to new highs seems to be underway. As long as 1630/40 holds, this count (wave V underway) looks good.
Silver ~ Update ~ 6 September 2012
It's been a very long time since I've posted an Elliott wave count for silver (early 2011: https://blogger.googleusercontent.com/img/b/R29vZ2xl/AVvXsEgg-JtHkHVw6C_1NbuThy542HEdgB2e6t3OG7K3X4QcGcy4p9hZ5KTy0g1AQsvigJGF-YHX62KC2S2_UbzfxDuSh9H2zz45ujtw1gjvJh4s2cHlShjRBBsGfxlaavsMWytTflAer_sloIE/s1600/silver01022011a.jpg).
Thus it's time for an updated count:

If 26$ is indeed the low of wave IV, wave V to new highs should now follow.
Interestingly, during wave I and III silver rose about 430% (433% in wave I and 427% in wave III). If we get another 430 % rally during wave V, the target would be 138 $ (!).
Thus it's time for an updated count:

If 26$ is indeed the low of wave IV, wave V to new highs should now follow.
Interestingly, during wave I and III silver rose about 430% (433% in wave I and 427% in wave III). If we get another 430 % rally during wave V, the target would be 138 $ (!).


EUR/CHF ~ Update ~ 6 September 2012
Exactly one year ago the Swiss National Bank (SNB) decided to peg the CHF to the EUR:

One year later the minimum rate at 1.20 still holds as the SNB doubled its foreign exchange reserves to 400 bln.
While this increase is worrying, I doubt that the SNB will stop buying EUR anytime soon. The Swiss economy isn't spared from the problems in the EU. It's not as bad as in the EU as the unemployment rate is still low at 2.9% and the GDP only started to decrease in the most recent quarter (-0.1%). But I still doubt that the SNB will put even more pressure on the economy anytime soon.
Wednesday, September 5, 2012
EW counts on one page
I added a new page where I list my latest EW counts.
So, instead of searching my blog for the latest counts you can now click on "EW-Counts" in the navigation bar above and then you see all counts on one page.
(At the moment, there are only a few counts. But by the end of this week there should be many more)
So, instead of searching my blog for the latest counts you can now click on "EW-Counts" in the navigation bar above and then you see all counts on one page.
(At the moment, there are only a few counts. But by the end of this week there should be many more)
Dow Jones ~ Intraday Update ~ 5 September 2012
Still inside the range... : )
Below is a possible bearish count (for the Dow but it also works for the SPX):

At the moment, I'd slightly prefer the bullish over the bearish count (because of the election cycle). But as you can see in the charts, I'd like to see a break of 13200/1416 or 12800/1375 first.
Below is a possible bearish count (for the Dow but it also works for the SPX):

At the moment, I'd slightly prefer the bullish over the bearish count (because of the election cycle). But as you can see in the charts, I'd like to see a break of 13200/1416 or 12800/1375 first.
S&P 500 ~ Intraday Update ~ 5 September 2012
We're still inside the range (1397-1416) thus the break could still happen either way.
Below is a possible count if the range breaks up, i. e. if the SPX rallies above 1416:


Below is a possible count if the range breaks up, i. e. if the SPX rallies above 1416:


S&P 500 ~ Pre-Market Warm-Up ~ 5 September 2012
In this post I showed you what usually happens after the SPX hit a new high. So far, this pattern has worked really well as the market corrected about 30 handles from the high.
The similiarities between the first occurence of this pattern (see chart in the link above) and today are striking:
The SPX and the ES in 2010:


The SPX and the ES today:


So, if the triangle breaks up, we might not only get to new highs but rally to much higher levels (1500+), similar to what happened in 2010.
Tuesday, September 4, 2012
Silver ~ Update ~ 4 September 2012
After the medium-term trend turned bullish two weeks ago, the long-term trend is now also up since silver broke the resistance area around 31-32:


S&P 500 ~ Intraday Update ~ 4 September 2012
SPX is at 1397ish again:


This level has been a strong support during August. Let's see if it holds in September as well.
Gold ~ Update ~ 4 September 2012
Since gold broke 1640 two weeks ago, it's already gained about 60$:

The next targets should be 1720ish and 1800ish.
As mentioned earlier, as long as we stay above 1630ish, the long- and medium-term trend is up.

The next targets should be 1720ish and 1800ish.
As mentioned earlier, as long as we stay above 1630ish, the long- and medium-term trend is up.
Subscribe to:
Posts (Atom)