Friday, June 29, 2012

S&P 500 ~ Intraday Update 2 ~ 29 June 2012

The SPX is now just underneath the resistance area (1357-66).


Whether or not this is a second wave, going short in this area might not be the worst idea. I expect at least a small pullback here.


Maybe you remember that in early May, 1385 was an important level. I think 1335 is now the new 1385. If we get a pullback below this level, then wave [iii] should be underway.

S&P 500 ~ Intraday Update ~ 29 June 2012

This is exactly why I wanted to see a break of 1307-10 first before going short:


We're almost back at the strong resistance around 1360. I still think that a break of this level would be medium-term bullish. Another failure in this area though, could lead to a similar outcome as in April/May.

Thursday, June 28, 2012

S&P 500 ~ Elliott Wave Count ~ 29 June 2012

Today's decline looked quite promising for the bears... until we got a huge rally late in the day:


Wave [ii] still seems to be underway and we could hit 1335 once again (or maybe rally even a bit higher).

Wednesday, June 27, 2012

S&P 500 ~ EOD Update ~ 27 June 2012

The SPX hit the resistance area at ~1335-37 shortly before the market closed:


Today's rally might have completed wave [ii]. If we get a break of 1307-10, wave [iii] should be underway. The minimum target for this third wave is the early June low. I think wave [iii] will decline further though, probably down to 1230-50.

S&P 500 ~ Intraday Update ~ 27 June 2012

The rally continues today and the SPX is quickly approaching the resistance level at 1335-37:


Tuesday, June 26, 2012

S&P 500 ~ Intraday Update 2 ~ 26 June 2012

After another test of the support at 1307-10, the SPX rallied and hit the first target a few minutes ago:


Silver ~ Update ~ 26 June 2012

Similar to gold, silver is still trading on neutral territory between 26 and 30 $:


S&P 500 ~ Intraday Update ~ 26 June 2012

It looks like the short-term count I posted yesterday is correct:


The target for this second wave should be 1326 to 1337.

USD/JPY ~ Update ~ 26 June 2012

After the breach of the downtrend channel earlier this month, the USD/JPY retested the channel a week later and then rallied to the resistance at 80.50:


I'm not quite sure if the upmove (since early June) is already over. Weak support is at 79.10-20 and then at around 78.60-80. If one of these two levels holds, we might see another rally back to 80.50 or even 81.75. If it doesn't hold, we should retest the very strong support area around 78.

Monday, June 25, 2012

Gold ~ Update ~ 25 June 2012

Gold is still oscillating between 1550ish and 1630ish. Unless one of these levels breaks, the medium-term trend remains neutral.


S&P 500 ~ Intraday Update ~ 25 June 2012

1326ish was breached at the open which resulted in a decline to the next strong support area by noon:


If this support level holds, I think we could see a rally back to 1326 or even 1335.

S&P 500 ~ Pre-Market Warm-Up ~ 25 June 2012

As said in my big picture update, if 1326 is breached, we could see a decline to 1200. The 1326ish level was first tested on Thursday which resulted in a bounce on Friday back to 1335ish.

The futures sold off during globex, so we should get the second test of the support level at 1326ish today.


Resistance is at 1335ish, next support after 1326 is at 1307-10.

Thursday, June 21, 2012

S&P 500 ~ Intraday Update ~ 21 June 2012

After yesterday's low was breached, the SPX quickly declined to the support at 1333-35:


Next support is at 1326ish and resistance is at 1348ish.

Wednesday, June 20, 2012

S&P 500 ~ Elliott Wave Count ~ 20 June 2012


Today's correction was most likely wave (iv). If so, we should see a rally to 1365 tomorrow/on Friday to complete an impulse from 1307.

Big Picture ~ 20 June 2012

Review
In my 
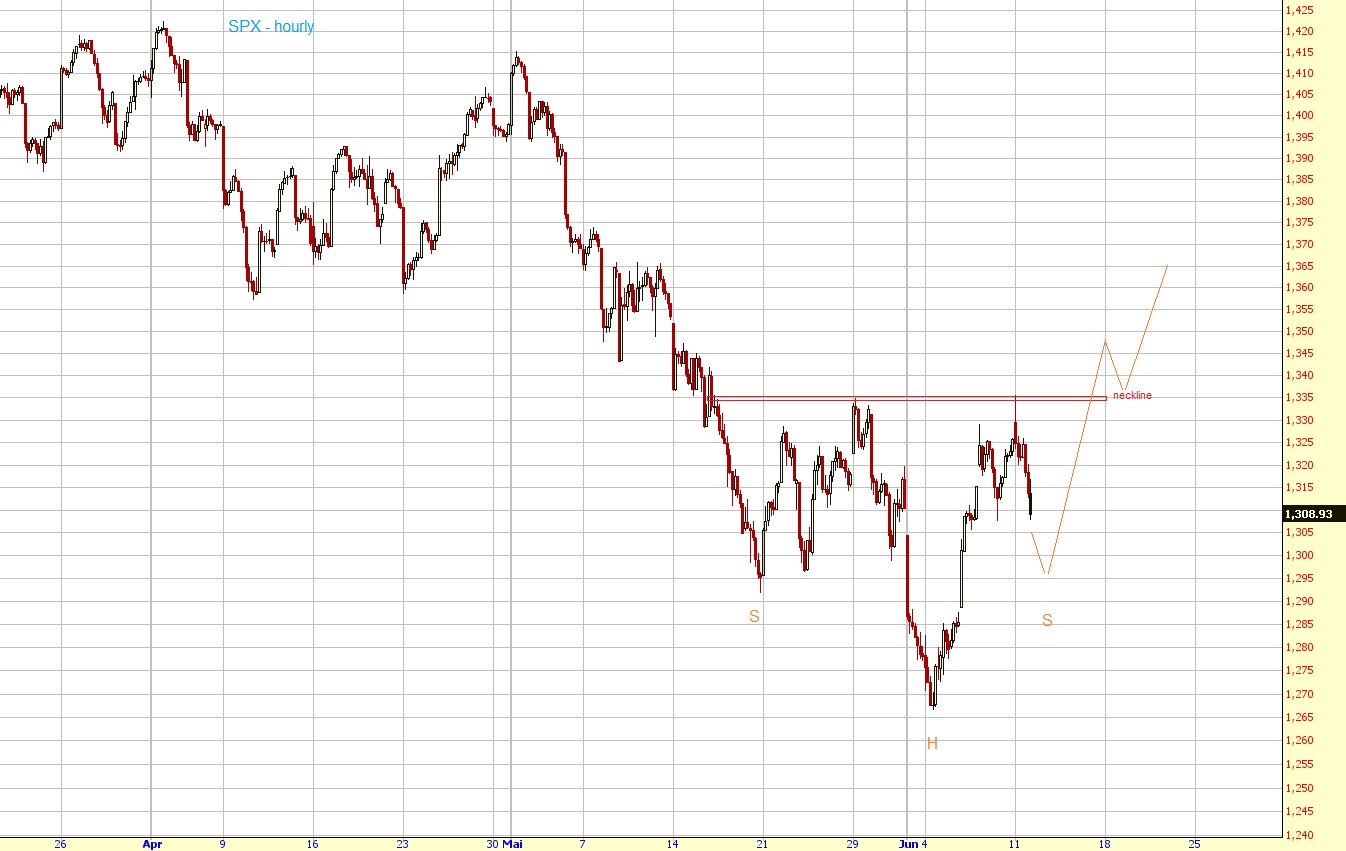
last update I expected that the market would form a bottom between 1250 and 1270 and then rally to 1300-40. On June 6th I turned bullish and raised my target to 1330-65. Yesterday, the SPX hit the higher end of my target area (1363) thus I think it's time to have a look at the different scenarios again.

Outlook
1360-65 should be an important level.

Short-term
We got five waves down from April till June and now three waves up. So, the count looks pretty good:


If 1326 and 1335 are breached, the next wave towards 1200 is most likely underway. Should we get two consecutive daily closes above 1365ish, this count is most likely wrong.


Medium/Long-term
I'm still not sure which long-term count I like more but I think it's not really important because we should see a decline to 1200 in any case:

Bearish for 2012 but bullish for late 2012/2013:


Bearish for the next few years:


What if 1360-65 is breached?
If this level is broken, I expect a rally back to the highs and most likely even higher.

Possible bullish count (for the Dow Jones):


This count is invalid below 12550 / 1326 (SPX).

Summary
Above 1365 = bullish
Between 1326-65 = neutral
Below 1326 = bearish

Tuesday, June 19, 2012

S&P 500 ~ Elliott Wave Count ~ 19 June 2012

The rally continued today and we hit my target area at 1360-65:


After turning bullish early June at 1300 I'm now back to neutral again. If the market breaks below 1335ish I might turn bearish again and if the market breaches 1365ish I might be bullish again. More on that tomorrow before the open.

Monday, June 18, 2012

S&P 500 ~ Elliott Wave Count ~ 18 June 2012

The SPX opened slightly lower today and tested the neckline at 1335 shortly after the open. The rally then continued and we went as high as 1348 which is only about 1 % below the huge resistance area at 1360-65:


As long as there is no decline below 1326ish, the medium-term trend is up.

Friday, June 15, 2012

S&P 500 ~ Elliott Wave Count ~ 15 June 2012

After 1326 was finally breached yesterday, the rally continued today and we're now already above 1340:


Thursday, June 14, 2012

S&P 500 ~ Elliott Wave Count ~ 14 June 2012

1326ish was finally breached late in the day, thus the bullish count is now much more likely than the bearish one:


The next resistance is around 1335 which is also the neckline of an inverse H&S. If 1335ish is breached, the next target is 1360-65.

S&P 500 ~ Intraday Update ~ 14 June 2012

What a rollercoaster ride during the past few days:


We're back near the resistance around 1326. Let's see if we can breach it today.

Wednesday, June 13, 2012

S&P 500 ~ EOD Update ~ 13 June 2012

The SPX hit the resistance at 1326ish multiple times today but never breached it:


Since neither 1307 nor 1326 has been breached, both counts are still possible: http://www.wavaholic.com/2012/06/s-500-elliott-wave-count-12-june-2012.html


S&P 500 ~ Intraday Update ~ 13 June 2012

The SPX hit the resistance at 1326ish twice today but has failed to break through so far:


Thus, both counts are still possible: http://www.wavaholic.com/2012/06/s-500-elliott-wave-count-12-june-2012.html

Tuesday, June 12, 2012

S&P 500 ~ Elliott Wave Count ~ 12 June 2012

This is basically an update of the two counts I showed yesterday (http://www.wavaholic.com/2012/06/s-500-eod-update-11-june-2012.html).

Today's action actually fits both counts. So it's too early which way the market goes for the next few days.

If 1326 and 1335 are breached, it's very likely that the bullish count is underway and I think we should see a rally to at least 1360:


If the SPX declines below today's low, the bearish count looks much better and we should see a decline to the early June lows:


EUR/USD ~ Update ~ 12 June 2012

We got a small rally but we're still below 1.26-1.265. So this could be just a bounce followed by another decline to even lower levels than in May.


If 1.26-1.265 is breached though, the sell-off should be over and I expect a rally to 1.30.

S&P 500 ~ Intraday Update 2 ~ 12 June 2012

I got my rally to 1320 : )


If we manage to get above 1326, the bullish count is very likely. If we stay below it, the bearish count is still possible (http://www.wavaholic.com/2012/06/s-500-eod-update-11-june-2012.html)

S&P 500 ~ Intraday Update ~ 12 June 2012

It looks like we completed five waves down a few minutes ago. If 1307.5ish holds we could get a rally to 1320:


Gold ~ Update ~ 12 June 2012

We didn't get a close above 1630 last week so I remain neutral on gold:


As you can see in the chart, the situation for gold is similar to the one for silver. Support is at 1550ish and resistance at 1630. The medium-term trend is bearish again if 1550 is breached and bullish if 1630 is broken.

Silver ~ Update ~ 12 June 2012

As said in my last update, the targets for a rally are 30ish and 31.3ish. Silver hit 30$ last week:


We continue to trade between the resistance areas 31.3 & 30 and the support area at 26-27. As long as we remain between these levels I'm neutral on silver (medium-term).

The medium-term and possibly even the long-term trend is back to bullish if 31.3ish is breached. If 26 is broken the medium-term is bearish again and we could decline to 20 $.

Monday, June 11, 2012

S&P 500 ~ EOD Update ~ 11 June 2012

Wow, what a reversal. I remember that we got a similar reversal in 2010. I think back in 2010 China reported some numbers overnight, the market gapped up, reversed, and closed lower:


As you can see that day was an important top. It could be similar today:


If 1295ish doesn't hold the next impulse to new lows below 1267 is most likely underway.

As long as this level holds though it's still possible that we get an inverse H&S:


RIMM ~ Update ~ 11 June 2012

A reader asked me whether I could post an EW count on RIMM. Here you go ; )


I'm probably biased because I got an iphone and no blackberry but I tried to be as objective as possible:


I think RIMM is forming a zigzag from the top in 2008. It looks like we're at the end of the third wave of wave [C]. Next should be a fourth wave correction to 12.5-15 $ followed by another sell-off to new lows to complete the zigzag.

If we get above 15 $ wave [C] is probably over.

S&P 500 ~ Intraday Update ~ 11 June 2012

The SPX opened right at the resistance at 1335 and then sold off:


Interestingly, the SPX and the Nasdaq cash index haven't breached the neckline of the inverse H&S (see last post) yet.

Globex Update ~ 11 June 2012

The futures gapped up and are currently trading about 1 % higher than on Friday:


As you can see the SPX and the Nasdaq formed an inverse H&S. The targets are 1400 and 2710. These targets are valid as long as we stay above the neckline.

If the SPX opens higher today (and at the moment it looks like it does...) wave [c] should be underway. Possible target is the 1360-65 area.


Wednesday, June 6, 2012

S&P 500 ~ EOD Update ~ 6 June 2012

We got a huge rally today. Basically all stocks closed higher. Yes, even Facebook. Go figure!

As already mentioned in my earlier update I expect a rally to 1330-40 (probably even to 1360 though):


I'd like point out that in 2011 we also got what appeared to be five waves down. It turned out not to be the case though. So if we get a rally into that 1330-60 area I'd like to see some kind of a reversal first before considering to go short.


You probably noticed that in my big picture update I showed the five wave move down only for the SPX and the Nasdaq. The reason is quite simple: there is no five wave move down for the Dow:


As you can see it will be very interesting to see what happens at SPX 1330-60/ Dow 12600-12800. If we reverse, another sell-off into late 2012 should follow. If we break it, a huge rally similar to late 2011/early 2012 should occur.

So short-term it looks like the most recent lows should hold. Medium- to long-term though the situation remains very unclear.

S&P 500 ~ Intraday Update ~ 6 June 2012

The SPX broke 1300 early in the morning indicating that wave [v] is completed:


We should now get a rally towards 1330-40 over the next few weeks.