Thursday, October 28, 2010

S&P 500 ~ Intraday Update 1 ~ 28 October 2010

So far, everything goes according to plan:


As I said there are many possibilities how wave [c]/[y] could unfold. These are just two scenarios. At the moment I tend to the triangle count (wave [y]) but a break of 1172 will likely send the market lower to 1160ish.

Wednesday, October 27, 2010

S&P 500 ~ Elliott Wave Count 27 October 2010

The SPX breached 1178 in the afternoon thus I think wave [a]/[w] of 4 finished at 1172 today:


Wave [b]/[x] should unfold now. After that either a wave [c] or [y] should complete this sideways correction. It's difficult to give any target for wave 4 because wave [y] could unfold in a triangle, in a flat or a zigzag, so the target area ranges from 1150 to 1180.

S&P 500 ~ Intraday Update 1 ~ 27 October 2010

The SPX broke below the channel and reached my first target (1170ish) a few minutes ago:


As long as there is no rally above 1178 I expect the SPX to go lower to around 1160 by tomorrow to complete wave [a] of 4.


Yesterday I accidentally mixed up the wave degree in my short term count. All waves should be one degree higher (e.g. instead of [iii]: 3). Sorry for that.

Tuesday, October 26, 2010

S&P 500 ~ Elliott Wave Count 26 October 2010

The SPX gapped down today and then found support in the 1180 area which I mentioned yesterday as an important level. Although 1180ish held the potential ending diagonal doesn't look like a diagonal anymore, it's more like a channel now:


Of the two short term counts I posted yesterday the expanded flat looks now much better (see chart above). As long as the SPX stays in the channel I won't rule out a rally to 1200 though:

- Break below the channel: expanded flat count, expecting 1170 and 1160 next
- Break above 1192: the SPX may hit the upper channel line again between 1200-1210


Comparing Oct 09-Apr 10 to today:


Top on Nov 11th?

Monday, October 25, 2010

S&P 500 ~ Elliott Wave Count 25 October 2010

The SPX almost hit 1200 today so it looks like I was a bit early to label 1189 as the high of wave 3.

Medium term my forecast hasn't really changed though, I still expect some sideways action for the next weeks (end of wave 3 and wave 4) before the end of year rally starts (wave 5).

Short term I see two possibilities. Either today's high is part of an ending diagonal (see chart below) or it is a wave b high of and expanded flat in the wave 4 position. As long as 1180ish holds I think the ending diagonal is underway and the SPX should hit 1200 tomorrow:

Sunday, October 24, 2010

S&P 500 ~ Weekend Update ~ 24 October 2010

First a short update on what happened on Friday:

I think last Friday goes down in history as the most boring trading day of 2010:


The VIX was nearing 0...


... and I just hope it doesn't go on like that until after elections.


It could happen though since wave 3 likely ended at 1189 and wave 4 should unfold as a sideways correction (because wave 2 was a sharp correction (rule of alternation)):


Unless 1190 gets breached I think the SPX will move sideways between 1160 and 1190 for the next two weeks.

Wednesday, October 20, 2010

Tuesday, October 19, 2010

S&P 500 ~ Elliott Wave Count 19 October 2010

Bear porn today! The SPX lost over 1.5 %!


Last time the SPX decline more than 1 % on one day was on Sept 7th by the way.


So, was today the comeback of the bears or just another bear trap?

So far, the decline looks corrective (three waves from 1186) thus this could either be wave [iv] of 3 or a part of wave 4:


Either one of those counts is underway or the long-forgotten bearish count. Remember, 1180 was never breached so the bearish count is still a possibility to consider.

However, I'm still leaning towards the bullish count expecting a nice end of year rally.

Sunday, October 17, 2010

S&P 500 ~ Weekend Update ~ 17 October 2010

Last week the SPX approached the resistance area between 1175 and 1180 and tried to breach it. So far the bulls failed to do so but the bears couldn't profit from it either since the market was just consolidating just below that level.

Even though 1180ish hasn't been breached yet I'm leaning towards the bullish scenario, i. e. new highs above 1220 later this year.


I expect wave 3 to peak between 1220 and 1250, followed by a sideways wave 4 consolidation and finally an end of year rally to 1300ish to complete wave (1).


Below you can see my bullish long term count. Can't remember when I posted it last time so I thought it's about time...


Basically, it's a copy of the bear market in the 60's/70's. So, first, I expect a new all time high (!) at around 1600 anytime next year or in 2012 and then a new bear market low below 666 late 2012/13 (12/21/2012 possibly?... : ) ).
At first it may look a bit unlikely but at second glance it isn't that unrealistic: A new all time high sponsored by the FED and once the high is reached the whole system blows up...


Have a nice week and feel free to comment or write me an email to admin|at|wavaholic|com.

Hugo

Thursday, October 14, 2010

S&P 500 ~ Elliott Wave Count 14 October 2010

We got a small correction today retesting the previous resistance area. At around 3 pm the end of day rally started which continued afterhours when Google reported. The ES is currently at 1175 back where it closed yesterday after being down more than 10 handles by 3 pm!


Well, still no break above the 1180 area but I guess tomorrow it could happen?


Once 1180 is cleared I think wave 3 will challenge the 1220 high and possibly reach the inverse H&S target at 1250.

S&P 500 ~ Elliott Wave Count 13 October 2010

We didn't get the convincing break of the 1180 area but still I think that the bullish count is underway now (a close above today's high should confirm it).


I expect wave 3 to top between 1220 and 1250 (April high, 1.62 extension, inverse H&S target).

Wednesday, October 13, 2010

S&P 500 ~ Pre-Market Warm-Up 13 October 2010

The ES is up huge this morning, trading at the mid May high at 1174!

I mentioned the 1170-80 area as an important level in some of my earlier posts. If we get a convincing break of this level I'll turn bullish and expect a rally to new yearly highs.


Bullish count if the SPX breaches 1180ish.


Monday, October 11, 2010

Sunday, October 10, 2010

S&P 500 ~ Elliott Wave Outlook on October 2010

My outlook on October is a bit late but better late than never. ; )

First a short review of September:

In my post "Elliott Wave Outlook on September 2010" I wrote that I expected a bearish month unless "1040 holds and we get a strong rally starting tomorrow." Well, the next day the big rally occured and I turned bullish expecting a rally into mid September. I then stayed bullish until the SPX broke below 1136 on September 22th. Since then I've been standing aside waiting for the market to show its direction.


Outlook on October

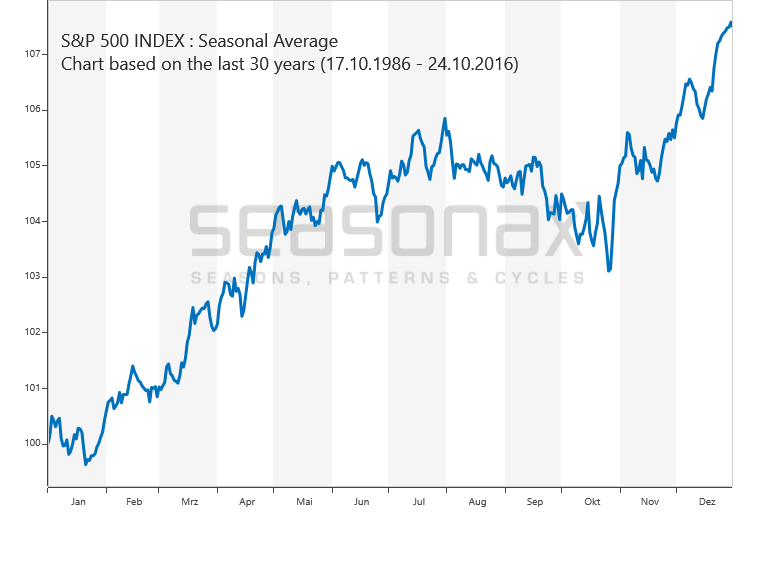
Since seasonality worked that well last month (.... : )) I decided to post a seasonal chart again:


We can see that early-mid October the SPX usually goes down but then in the last week the end of year rally starts. But since already September was upside down what if it happens again?


For almost three weeks now the SPX has been moving sideways (well, slightly higher) and as long as there is no major break down or up I'm standing aside.

On the upside 1170-80 is an important level. Should the market breach this level with conviction I think the bullish count below is underway:


If the market breaks the 1175ish level I think it will challenge the high at 1220. By the end of the year we could see 1300!


On the downside an important level is the neckline of the inverted H&S at 1130ish. If this level doesn't hold this market could go way lower in the coming months:


Interesting times ahead let's see which way the market decides to go ; )

Wednesday, October 6, 2010

S&P 500 ~ Elliott Wave Count 6 October 2010

The SPX consolidated today after yesterday's big rally. Despite the new rally high I'm still standing aside; the market is still below/above my key level to turn bullish (1175)/bearish (convincing break of 1130).


Both Elliott Wave counts are still valid. Either we're in a third wave up to 1250-1300 or about to finish Minor wave 2. I slightly tend to the bearish count because of various reasons (EW count looks good, smart money is moving out of stocks (in fact they haven't been that bearish since December 08 (read here http://cotstimer.blogspot.com/))) but as long as the stock market rallies day after day without any correction there's just no reason for me to turn bearish.

Sunday, October 3, 2010

S&P 500 ~ Weekend Update ~ 3 October 2010

All last week the SPX was trading in a narrow range between 1140 and 1150. The question is whether this is a consolidation before another rally or a topping process. In the past year, such sideways trends were usually a sign that the market was topping (with one exception in March 10).


I still like this fractal. Is it gonna happen though???


No change in my Elliott Wave count since the market was basically dead last week. Either we get a bearish (close below 1120) last quarter or a bullish one (above 1175-80)