
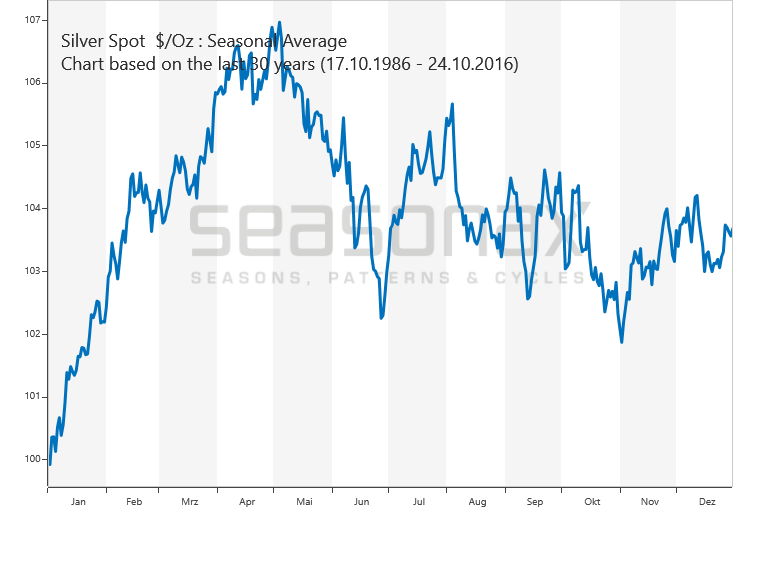
I you have a look at the chart you can see that the seasonality of silver is similar to the one of gold. They both peak mid February, correct till summer and then rally again. This has worked almost every year since 2003 so 2011 may unfold similar.
When I posted the long term count last year I wasn't really happy with it to be honest. I tried to adapt it to my gold count, so I counted the crash in 08 as Primary wave [4]. But if you look at the chart wave [4] compared to waves [1] and [2] doesn't look very good, does it? Thus, I changed my long term count as follows:

I think it's much nicer this way. The recent rally is just too big to be a fifth wave imo, so cycle wave III underway fits better.
Cycle wave I was 17.43 $, so if III = 1.62*I then the target for wave III were 36.6 $.
If we look at a long term chart we usually take the logarithmic scale so I think it's wrong to take the arithmetic fibonaccis to calculate a target for wave III. I think it's better to take the 'percentage' or 'logarithmic fibonaccis'. I don't know if they exist but if they didn't they do now lol. I'd like to explain it in a dow chart:

(if you don't like math, skip this part... : ))
Wave I was about 150 points, III ~900 and V 11000. So, the normal fibonaccis weren't really useful.
If we have a look at the percentage gains of the three waves though we'll get a nice fibonacci relationship:
I : + 382 %
III : + 980 % ; about 2.61*wave I
V : + 1961 %; about 2*wave III
and the same for the logarithmic fibos:
I : ln(155) = 5.04
III : ln(908.4) = 6.81; about 1.38*wave I
V : ln(11180.28) = 9.32; about 1.38*wave I
(ok read again if you've skipped the math part.. : ))
So, the targets based on these new fibos are:
67.48$ (%) and 110$ an ounce (ln(x)) (with a 1.62 multiplier)
This target is ridiculous!!
Perhaps yes, but if gold rallies, then silver may rally even more:
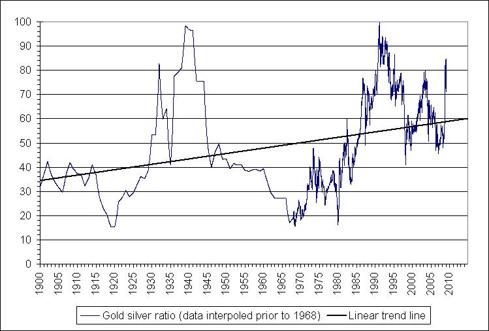
Silver is about 17 times more abundant than gold in the earth's crust. Over the centuries the gold silver ratio was around 15 (so near the natural 17:1 ratio). Recently (since 1900), the ratio was trading between 17 and 100 though, currently it's at 46. So if the ratio went back to 17 silver should be priced at 90$ an ounce...
If you're interested in this topic you can read the following article: http://seekingalpha.com/article/206897-the-historical-gold-silver-ratio-and-why-it-s-time-to-buy-silver
 |
| (source) |
So let's see if I am too bullish on silver and gold and if it was wise to change my counts. I think it was (else I wouldn't have changed it lol), but only time will tell.